
US Teens lag, Asians Dominate in PISA global education rankings
Math
http://en.wikipedia.org/wiki/PISA_2012_Tests
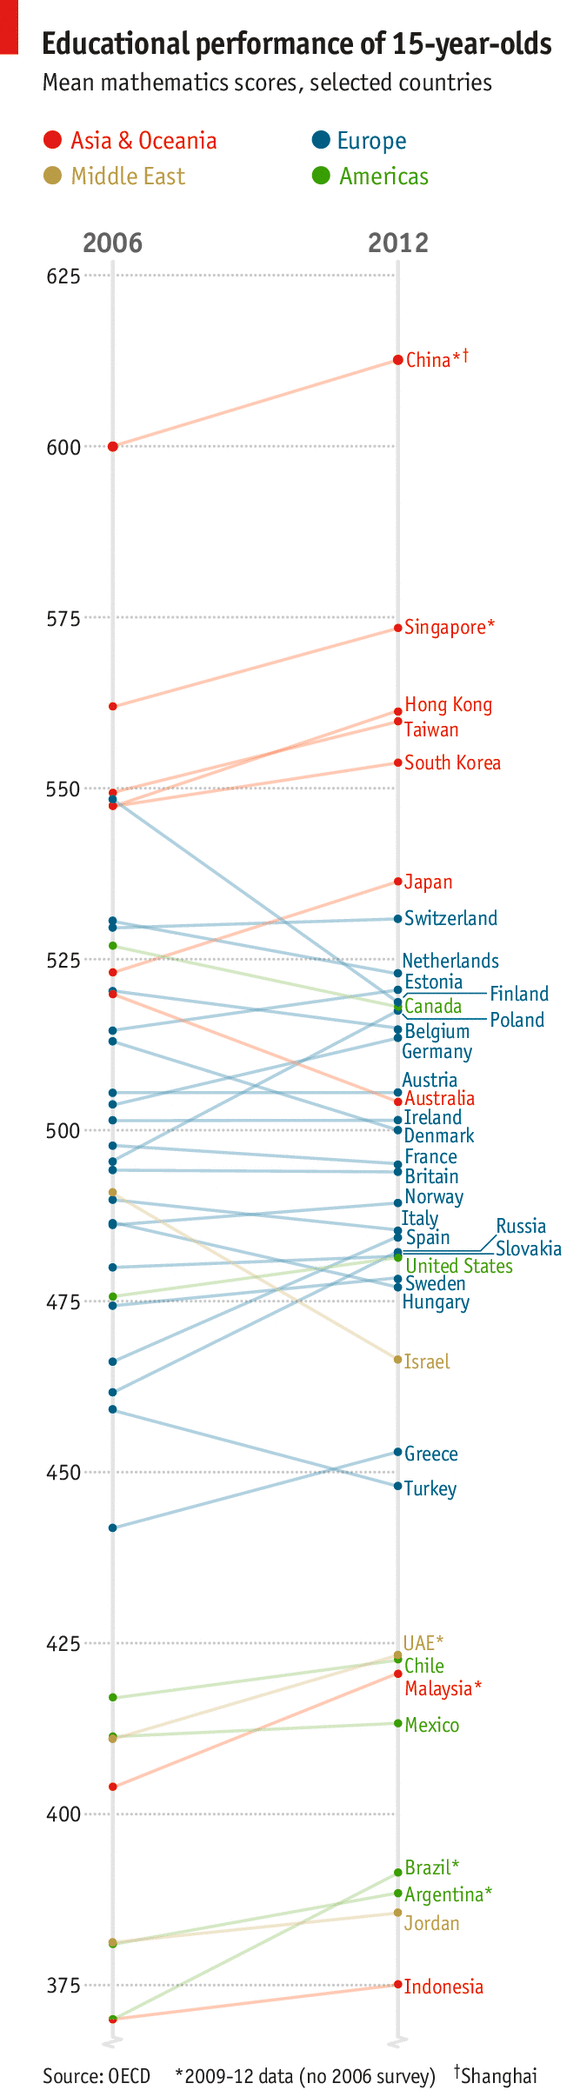
- Economist School league tables: Finn-ished | The Economist Dec 07, 2013 Finns were at the top when the PISA was introduced, but Finland and other European nations have fallen as Asian nations have risen to dominate the top. The chart shows that the top spots in mathematics are Shangai, Singapore, Hong Kong, Taiwan (66% Buddhism and Taoism), South Korea (50% no religion) and Japan (84% to 96% Shinto and Buddhism) and all have risen since 2006. The two Asian nations at the bottom are largely muslim Malaysia (65%) and Indonesia (88%)
- Steve Sailer: iSteve: PISA Racial results for Americans on Math Asian Americans score about as well as the best Asian nations, Euro-Americans as well as the better Europeans, while African Americans score on par with some of the lower European nations and above latin American or middle eastern nations.
- Time: Students in Shanghai scored highest (China doesn't report on the whole country); Singapore, Japan and Hong Kong followed. U.S. students fell in the middle in all categories, with Peru, Indonesia and Qatar coming in last. Read more: A nation of C students - TIME http://content.time.com/time/magazine/article/0,9171,2159268,00.html#ixzz2nkZ9ABN9A
- Investors Business Daily: To Be Worried: U.S. Students Falling Behind By FAREED ZAKARIA The top four slots in all three categories — math, reading, science — are taken by Shanghai (China), Singapore, Hong Kong, Taiwan, or Japan.
- PISA's China Problem | Brookings Institution www.brookings.eduOct 9, 2013 - A dozen or so provinces in China take the PISA, along with two special ...The dropout rate runs as high as 25 percent in middle schools. About 84 percent of Shanghai high school graduates go to college, compared to 24 percent nationally. Shanghai’s per capita GDP is more than twice that of China as a whole. Shanghai parents will annually spend on average of 6,000 yuan on English and math tutors and 9,600 yuan on weekend activities, such as tennis and piano. During the high school years, annual tutoring costs shoot up to 30,000 yuan and the cost of activities doubles to 19,200 yuan. the total expenses for tutoring and weekend activities in Shanghai exceed what the average Chinese worker makes in a year (about 42,000 yuan or $6,861). high school attendance rates are as low as 40 percent in poor, rural areas of China. The dropout rate runs as high as 25 percent in middle schools. The schools are often run down and poorly staffed. Classrooms packed with 130 students have been reported.
- Tom Loveless: Why Shanghai Leads the World on International ...dianeravitch.net Dec 2, 2013 - (antother look at loveless )Shanghai is a Province-level municipality and has historically attracted the nation's elites. About 84 percent of Shanghai high school graduates ...
High School Grads in China, India Are Better Prepared for College ...
Aug 27, 2012 - China and India ramped up investment in public education, increasing high school attendance and graduation rates. As many U.S. school ...
| 1 | 613 | |
| 2 | 573 | |
| 3 | 561 | |
| 4 | 560 | |
| 5 | 554 | |
| 6 | 538 | |
| 7 | 536 | |
| 8 | 535 | |
| 9 | 531 | |
| 10 | 523 | |
| 11 | 521 | |
| 12 | 519 | |
| 13 | 518 | |
| 14 | 518 | |
| 15 | 515 | |
| 16 | 514 | |
| 17 | 511 | |
| 18 | 506 | |
| 19 | 504 | |
| 20 | 501 | |
| 21 | 501 | |
| 22 | 500 | |
| 23 | 500 | |
| 24 | 499 | |
| 25 | 495 | |
| 26 | 494 | |
| 27 | 493 | |
| 28 | 491 | |
| 29 | 490 | |
| 30 | 489 | |
| 31 | 487 | |
| 32 | 485 | |
| 33 | 484 | |
| 34 | 482 | |
| 35 | 482 | |
| 36 | 481 | |
| 37 | 479 | |
| 38 | 478 | |
| 39 | 477 | |
| 40 | 471 | |
| 41 | 466 | |
| 42 | 453 | |
| 43 | 449 | |
| 44 | 448 | |
| 45 | 445 | |
| 46 | 440 | |
| 47 | 439 | |
| 48 | 434 | |
| 49 | 432 | |
| 50 | 427 | |
| 51 | 423 | |
| 52 | 421 | |
| 53 | 413 | |
| 54 | 410 | |
| 55 | 409 | |
| 56 | 407 | |
| 57 | 394 | |
| 58 | 391 | |
| 59 | 388 | |
| 60 | 388 | |
| 61 | 386 | |
| 62 | 376 | |
| 63 | 376 | |
| 64 | 375 | |
| 65 | 368 |
PISA 2012 was the fifth survey of the OECD Programme for International Student Assessment, testing about 510 000 students around age 15 in 65 countries and economies on mathematics, science and reading. The test had a special focus on mathematics.[1]
Shanghai had the highest score in all three subjects. It was followed by Singapore, Hong Kong, Chinese Taipei and Korea in mathematics; Hong Kong, Singapore, Japan and Korea in reading and Hong Kong, Singapore, Japan and Finland in science
PISA 2012 was the fifth survey of the OECD Programme for International Student Assessment, testing about 510 000 students around age 15 in 65 countries and economies on mathematics, science and reading. The test had a special focus on mathematics.[1]
Shanghai had the highest score in all three subjects. It was followed by Singapore, Hong Kong, Chinese Taipei and Korea in mathematics; Hong Kong, Singapore, Japan and Korea in reading and Hong Kong, Singapore, Japan and Finland in science.
Contents
[hide]Test[edit]
About 510 000 students between 15 years, 3 months and 16 years, 2 months took part in the test. They were a sample of about about 28 millions in the same age group in 65 contries and economies,[1] including the OECD countries, severalChinese cities, Vietnam, Indonesia and several countries in South America.[2]
The test lasted two hours, was paper-based and included both open-ended and multiple-choice questions.[1]
The students and school staff also answered a questionaire to provide background information about the students and the schools.[1][2]
Results[edit]
PISA 2012 was presented on 3 December 2013, with results for around 510,000 participating students in all 34 OECD member countries and 31 partner countries.[3] This testing cycle had a particular focus on mathematics, where the mean score was 494. The mean score in reading was 496 and in science 501.
The results show distinct groups of high-performers in mathematics: the East Asian countries, with Shanghai-China scoring the best result of 613, followed closely by Hong Kong, Japan, Taiwan and South Korea.Among the Europeans, Liechtensteinand Switzerland performed best, with Netherlands, Estonia, Finland, Poland, Belgium, Germany, Austria all posting mathematics scores "not significantly statistically different from" one another. The United Kingdom, Ireland, Australia andNew Zealand were similarly clustered around the OECD average of 494, with the USA trailing this group at 481.[3]
Qatar, Kazakhstan and Malaysia were the countries which showed the greatest improvement in mathematics. USA and the United Kingdom showed no significant change.[4] Sweden was the country which had the greatest fall in their performance in mathematics over the last ten-year, with a similar falling trend also in the two other subjects and leading politicians in Sweden expressed great worry over the results.[5][6]
Boys on average scored better than girls in mathematics, girls scored better than boys in reading while the two genders had quite similar scores in science.[4]
Indonesia, Albania, Peru, Thailand and Colombia were the countries where most students reported being happy at school, while students in Korea, the Czech Republic, theSlovak Republic, Estonia and Finland reported least happiness.[1]
Specific results and reaction from various countries[edit]
China[edit]
China didn't participate as a nation, but Shanghai and Hong Kong participated as their own entities. Shanghai who participated for the second time topped the rankings in all three subjects as well as improving their score in the subjects compared to the 2009 tests. Shanghai's score of 619 in mathematics were 119 points about the average score, putting the performance of Shanghai pupils about 3 school years ahead of pupils in average countries. Educational experts debated to which degree the result reflected the quality of the general educational system in China, pointing out that Shanhai has greater wealth and better-paid teachers than the rest of China.[7] Hong Kong placed second in reading and science and third in maths.
China is expected to participate as a country in the 2015 tests.[8]
United States[edit]
The American result was average in science and reading, but lagged behind in mathematics compared to other developed nations. There was little change from the previous test in 2009.[9] The result was describes as “a picture of educational stagnation” by Education Secretary Arne Duncan[10] who said the result was not compatible with the American goal of having the world's best educated workers. Randi Weingarten of the American Federation of Teachers stated that an overemphasis on standarised test participated to the lack of improvement in education performance.[11] Dennis Van Roekel of the National Education Association said a failure to adress poverty among students had hampered progress in performance.[9]
About 9% of the students scored in the top two mathematics levels compared to 13% in all countries and economies.[9]
Massachusetts, Connecticut and Florida also participated in the tests as separate entities, with Massachusetts scoring well above both the American and internatinal average, particularly in reading where they had the 4th best score overall.[11]
United Kingdom[edit]
As in 2009, the result was slightly above average for the United Kingdom, with the science ranking being highest (20).[12]England, Wales, Scotland and Northern Ireland also participated as separated entities, showing the worst result for Wales which in mathematics was 43 of the 65 countries and economies. Minister of Education in Wales Huw Lewis expressed disappointment in the results, said that there was no "quick fixes", but hoped that several educational reform that has been implented the last years would give better results in the next round of tests.[13]
United Kingdom had a greater gap between high- and low-scoring students than the average. There was little difference between public and private schools when adjusted for socio-economic background of students. The gender difference in favour of girls were less than in most other countries, as was the difference between natives and immigrants.[12]
Writing in the Daily Telegraph, Ambrose Evans-Pritchard warned against putting to much emphasis on the UK's international ranking, arguing that an overfocus on scholarly performances in East Asia might have participated to the areas low birthratewhich he argued could harm the economic performance in the future more than a good PISA score would outweight.[14]
Sweden[edit]
Sweden's result dropped in all three subjects, which was a continuation of a trend from 2006 and 2009. In mathematics, the nation had the sharpest fall in mathematic performance over 10 years among the countries that have participated in all tests, with a drop in score from 509 in 2003 to 478 in 2012. The score in reading showed a drop from 516 in 2000 to 483 in 2012. The country performed below the OECD average in all three subjects.[15]
Leader of the Oppositon Social Democrat Stefan Löfven described the situation as a national crisis.[16] Along with the party's spokesperson on education Ibrahim Baylan, he pointed to the downward trend in reading as most severe.[16]
Finland[edit]
Finland who got several top positions in the first tests fell in all three subjects, but remained the best performing country overall in Europe, getting their best result in science with 545 poinst (5th) and the worst in mathematics with 519 (12th) where the country were outperformed by four other European countries. The drop in mathematics was 25 points since 2003; the last time mathematics was the focus of the tests. For the first time Finnish girls outperformed boys in the subject, but only narrowly. It was also the first time pupils in Finnish-speaking schools did not perform better than pupils in Swedish-speakingschools. Minister of Education and Science Kristi Kiuru expressed concern for the overall drop, as well as the fact that the number of low-performers had increased from 7% to 12%.[17]
References[edit]
- ^ a b c d e PISA 2012 Results OECD. Retrieved 4 December 2013
- ^ a b PISA 2012 Results in Focus, OECD, 3 December 2013, retrieved 4 December 2013
- ^ a b PISA 2012 Results in Focus, OECD, 3 December 2013, retrieved 4 December 2013
- ^ a b Sedghi, Ami; Arnett, George; Chalabi, Mona (2013-12-03), Pisa 2012 results: which country does best at reading, maths and science?, The Guardian, retrieved 2013-02-14
- ^ Adams, Richard (2013-12-03), Swedish results fall abruptly as free school revolution falters, The Guardian, retrieved 2013-12-03
- ^ Kärrman, Jens (2013-12-03), Löfven om Pisa: Nationell kris, Dagens Nyheter, retrieved 2013-12-03
- ^ Tom Phillips (3 December 2013) OECD education report: Shanghai's formula is world-beating The Telegraph. Retrieved 8 December 2013
- ^ Sophie Brown (3 December 2013) Shanghai teens top international education ranking, OECD says CNN. Retrieved 8 December 2013
- ^ a b c Motoko Rich (3 December 2013) American 15-Year-Olds Lag, Mainly in Math, on International Standardized Tests New York Times. Retrieved 4 December 2013
- ^ Simon, Stephanie (2013-12-03), PISA results show "educational stagnation" in US, Politico, retrieved 2013-12-03
- ^ a b Vaznis, James (2013-12-03), Mass. students excel on global examinations, Boston Globe, retrieved 2013-12-14
- ^ a b Adams, Richard (2013-12-03), UK students stuck in educational doldrums, OECD study finds, The Guardian, retrieved 2013-12-04
- ^ Pisa ranks Wales' education the worst in the UK BBC. 3 December 2013. Retrieved 4 December 2013
- ^ Ambrose Evans-Pritchard (3 December 2013) Ambrose Evans-Pritchard Telegraph.co.uk. Retrieved 4 December 2013
- ^ Lars Näslund (3 December 2013) Svenska skolan rasar i stor jämförelse Expressen. Retrieved 4 December 2013(Swedish)
- ^ a b Jens Kärrman (3 December 2013) Löfven om Pisa: Nationell kris Dagens Nyheter. Retrieved 8 December 2013(Swedish)
- ^ PISA 2012: Proficiency of Finnish youth declining University of Jyväskylä. Retrieved 9 December 2013
US teens lag in global education rankings as Asian countries rise to the top"
“While we are seeing some encouraging progress the United States’ performance on the 2012 PISA is educational stagnation
What You Need to Know About the International Test Scores | Diane ...
www.huffingtonpost.com/...ravitch/international-test-scores_b_4379533....
Dec 3, 2013 - The news reports say that the test scores of American students on the latest PISA test are "stagnant," ... GET UPDATES FROM Diane Ravitch.
The U.S. Department of Education would have us believe -- yet again -- that we are in an unprecedented crisis and that we must double down on the test-and-punish strategies of the past dozen years.
The myth persists that once our nation led the world on international tests, but we have fallen from that exalted position in recent years.
Wrong, wrong, wrong.
Here is the background history that you need to know to interpret the PISA score release, as well as Secretary Duncan's calculated effort to whip up national hysteria about our standing in the international league tables.
The U.S. has never been first in the world, nor even near the top, on international tests.- ...In the Second International Mathematics Study (1981-82), students in 15 systems were tested. The students were 13-year-olds and seniors. The younger group of U.S. students placed at or near the median on most tests. The American seniors placed at or near the bottom on almost every test. The "average Japanese students achieved higher than the top 5 percent of the U.S. students in college preparatory mathematics" and "the algebra achievement of our most able students (the top 1 percent) was lower than that of the top 1 percent of any other country." ...The point worth noting here is that U.S. students have never been top performers on the international tests. We are doing about the same now on PISA as we have done for the past half century.Does it matter?
- ...He found no relationship between a nation's economic productivity and its test scores. Nor did the test scores bear any relationship to quality of life or democratic institutions. And when it came to creativity, the U.S. "clobbered the world," with more patents per million people than any other nation. I agree with Baker. The more we focus on tests, the more we kill creativity, ingenuity, and the ability to think differently. Students who think differently get lower scores. The more we focus on tests, the more we reward conformity and compliance, getting the right answer.
Never do they explain how it was possible for the U.S. to score so poorly on international tests again and again over the past half century and yet still emerge as the world's leading economy, with the world's most vibrant culture, and a highly productive workforce.
From my vantage point as a historian, here is my takeaway from the PISA scores:
Lesson 1: If they mean anything at all, the PISA scores show the failure of the past dozen years of public policy in the United States. The billions invested in testing, test prep, and accountability have not raised test scores or our nation's relative standing on the league tables. No Child Left Behind and Race to the Top are manifest failures at accomplishing their singular goal of higher test scores.
- ...
AFT (union) propoganda:
performance has been about the same - math below average
US schools with low poverty lead most nations with low poverty rates
in each group US is near the top
only 51% go to preschool, others are like 90%
japan and finland have strong teachers unions
Fareed Zakaria
U.S. Students Failing to Keep Up the Pace
Investors Business Daily
Top four slots in all three categories - math, reading, science are taken by Shanghai (China), Singapore, Hong Kong, Taiwan or Japan. They probably have the most test-centric systems in the world
not focused on rote memorization but ability to use skills to solve real-world problems [what education reformers want to emphasize instead of rote skills] in fact Americans do better on the TIMSS which is a more traditional test
Diane Ravitch pointed out US has never done very well on international tests, yet the American economy is stronger than many high scroing countries.
America benefits from free market economy, tradition of invention and entrepeneurship, immigrants, work ethic...
gap between Shangai and Massachusetts highest scoring US state equal to two years education
PISA reading scores by race: America does pretty well - Steve Sailer
isteve.blogspot.com/2013/12/pisa-reading-scores-by-race-america.html
Dec 3, 2013 - PISA reading scores by race: America does pretty well. On the .... Whatstates likely have the lowest performing white students? WV, TN, KY, OK ...
Steve Sailer: iSteve: PISA Racial results for Americans on Math
isteve.blogspot.com/2013/12/pisa-racial-results-for-americans-on.html
Dec 3, 2013 - With PISA results being released today, you are going to hear a lot .....as to the racial breakdown of Oz results, on the state by state basis, from ...
PISA Racial results for Americans on Math
With PISA results being released today, you are going to hear a lot about how stupid American 15-year-olds are, but smart analysts remember to always adjust for race.
From the federal National Center for Education Statistics, a breakdown of 2012 PISA math scores showing how Americans of different races compare to the world. PISA scores are much like SAT scores, with an intended mean of 500 for the OECD (i.e., rich) countries and a standard deviation of 100. On PISA, Math is America's worst subject (Reading is its best).
From the federal NCES, a breakdown of 2012 PISA math scores for American students by race:
Level 6 is top 3%, like landing into Ivy League Cornell or Brown
Tech note: I imputed Asian and Multiracial percentages below Level I and Multiracial percentage in Level 6, which were left out of report due to small samples sizes.
For more postings devoted to analyzing PISA scores, click the Labels: PISA below.
From the federal National Center for Education Statistics, a breakdown of 2012 PISA math scores showing how Americans of different races compare to the world. PISA scores are much like SAT scores, with an intended mean of 500 for the OECD (i.e., rich) countries and a standard deviation of 100. On PISA, Math is America's worst subject (Reading is its best).
| OECD average | 494 |
| Shanghai-China | 613 |
| Singapore | 573 |
| Hong Kong-China | 561 |
| Chinese Taipei | 560 |
| Korea, Republic of | 554 |
| Asian-Americans | 549 |
| Macao-China | 538 |
| Japan | 536 --asians |
| Liechtenstein | 535 |
| Switzerland | 531 |
| Netherlands | 523 |
| Estonia | 521 |
| Finland | 519 |
| Canada | 518 |
| Poland | 518 |
| Belgium | 515 |
| Massachusetts-All Races | 514 |
| Germany | 514 |
| Vietnam | 511 |
| White Americans | 506 |
| Connecticut-All Races | 506 |
| Austria | 506 |
| Australia | 504 |
| Ireland | 501 |
| Slovenia | 501 |
| Denmark | 500 |
| New Zealand | 500 |
| Czech Republic | 499 |
| France | 495 |
| OECD Average | 494 |
| United Kingdom | 494 |
| Iceland | 493 |
| Multiracial Americans | 492 |
| Latvia | 491 |
| Luxembourg | 490 |
| Norway | 489 |
| Portugal | 487 |
| Italy | 485 |
| Spain | 484 --europe |
| Russian Federation | 482 |
| Slovak Republic | 482 |
| United States | 481 |
| Lithuania | 479 |
| Sweden | 478 |
| Hungary | 477 |
| Croatia | 471 |
| Florida-All Races | 467 |
| Israel | 466 |
| Hispanic Americans | 455 |
| Greece | 453 |
| Serbia, Republic of | 449 |
| Turkey | 448 |
| Romania | 445 |
| Cyprus | 440 |
| Bulgaria | 439 |
| United Arab Emirates | 434 |
| Kazakhstan | 432 |
| Thailand | 427 |
| Chile | 423 |
| African Americans | 421 |
| Malaysia | 421 |
| Mexico | 413 |
| Montenegro, Republic of | 410 |
| Uruguay | 409 |
| Costa Rica | 407 |
| Albania | 394 |
| Brazil | 391 |
| Argentina | 388 Arab------ |
| Tunisia | 388 |
| Jordan | 386 |
| Colombia | 376 |
| Qatar | 376 |
| Indonesia | 375 |
| Peru | 368 |
From the federal NCES, a breakdown of 2012 PISA math scores for American students by race:
Level 6 is top 3%, like landing into Ivy League Cornell or Brown
Below
level 1
|
Level 1
|
Level 2
|
Level 3
|
Level 4
|
Level 5
|
Level 6
| |
< 358
|
< 421
|
< 483
|
< 555
|
< 607
|
< 670
|
>= 670
| |
| Race/ethnicity |
%
|
%
|
%
|
%
|
%
|
%
|
%
|
| OECD average |
8.0
|
15.0
|
22.5
|
23.7
|
18.2
|
9.3
|
3.3
|
| U.S. average |
8.0
|
17.9
|
26.3
|
23.3
|
15.8
|
6.6
|
2.2
|
| White |
3.6
|
11.5
|
25.0
|
27.8
|
20.3
|
8.8
|
3.0
|
| Black |
21.0
|
32.0
|
25.3
|
14.0
|
6.7
|
1.0
|
‡
|
| Hispanic |
10.8
|
24.2
|
30.2
|
20.3
|
10.2
|
3.5
|
0.7
|
| Asian |
‡
|
5.4
|
15.6
|
23.6
|
28.1
|
16.1
|
9.0
|
| Multiracial |
‡
|
17.1
|
29.6
|
23.3
|
16.4
|
7.7
|
‡
|
| Asian 3X top Blacks -10X top | |||||||
| Cumulative: Bottom Up | |||||||
| OECD average |
8.0
|
23.0
|
45.5
|
69.2
|
87.4
|
96.7
|
100.0
|
| U.S. average |
8.0
|
25.8
|
52.1
|
75.4
|
91.2
|
97.8
|
100.0
|
| White |
3.6
|
15.1
|
40.1
|
67.9
|
88.2
|
97.0
|
100.0
|
| Black |
21.0
|
53.0
|
78.3
|
92.3
|
99.0
|
100.0
|
100.0
|
| Hispanic |
10.8
|
35.0
|
65.2
|
85.5
|
95.7
|
99.2
|
99.9
|
| Asian |
2.2
|
7.6
|
23.2
|
46.8
|
74.9
|
91.0
|
100.0
|
| Multiracial |
3.0
|
23.0
|
52.6
|
75.9
|
92.3
|
97.1
|
100.0
|
| Cumulative: Top Down | |||||||
| OECD average |
100.0
|
92.0
|
77.0
|
54.5
|
30.8
|
12.6
|
3.3
|
| U.S. average |
100.0
|
92.0
|
74.2
|
47.9
|
24.6
|
8.8
|
2.2
|
| White |
100.0
|
96.4
|
84.9
|
59.9
|
32.1
|
11.8
|
3.0
|
| Black |
100.0
|
79.0
|
47.0
|
21.7
|
7.7
|
1.0
|
0.0
|
| Hispanic |
99.9
|
89.1
|
64.9
|
34.7
|
14.4
|
4.2
|
0.7
|
| Asian |
100.0
|
97.8
|
92.4
|
76.8
|
53.2
|
25.1
|
9.0
|
| Multiracial |
100.0
|
94.1
|
77.0
|
47.4
|
24.1
|
7.7
|
0.0
|
Tech note: I imputed Asian and Multiracial percentages below Level I and Multiracial percentage in Level 6, which were left out of report due to small samples sizes.
For more postings devoted to analyzing PISA scores, click the Labels: PISA below.
my analysis
Level 6
Black top 0% =
White top 3% =
Asian top 10%
Level 5
Black top 1% =
Hispanic top 6%
White top 12% =
Asian top 25% =
What's up with Greece, Serbia, Romania, Bulgaria doing worse than Hispanics?
Australia
It would be interesting to see the racial breakdown of Australian results.
According to this article:
"According to the latest Program for International Student Assessment (PISA) results, the ''Australia'' of our most advantaged students is an education powerhouse.
Teenagers in the top socio-economic quartile of this country are achieving in maths at a level that would put them in the top five countries in the world and on par with standout performer Korea, according to Sue Thomson from the Australian Council for Educational Research.
By contrast, the Australia as represented by students in the lowest socio-economic quartile would be placed significantly below the OECD average, in about 40th position and on par with Greece.
Students who are indigenous are performing so poorly on average that their maths, reading and science results are equivalent to being 2½ years behind at school compared with their non-indigenous counterparts, while teenagers who live in the country are about a year behind their city counterparts. Students in Canberra are two years ahead of those in the Northern Territory when it comes to mathematical literacy."
Anyone who knows Canberra knows that it is White White White. It's so White it's Whiter than White. The children of the nation's elite live there in their own isolated terrasphere.
The Northern Territory, on the other hand, is Aboriginal, *real* Aboriginal. Darwin is also the most multiracial of all Oz cities. The Whites of the NT are mostly alcoholics and misfits.
The article asserts:
Australians pride themselves on their egalitarianism but factors such as the colour of your skin, the state you were born in and the size of your parents' bank balance have a significant bearing on how well children will do at school, and beyond.
According to the author, if you transferred all those Territorians to Canberra, and all those Canberrans to the Territory, the results would be reversed. And it's on that basis that:
"It was this finding that was at the heart of the national model recommended by David Gonski, which directs loadings - or additional funding - to schools based on predictors of education disadvantage, such as the number of students who are indigenous, from poorer backgrounds or attend a school in a remote area.
See, we're gonna fix all this inegalitarian evil through funding funding funding!
And, it'll work you know, unless that bastard Abbott and his Catholic minions get in the way.
Oh, wait a minute, an interesting interactive map.
The snapshot of international education achievement by the Organisation for Economic Co-operation and Development (OECD) released on Tuesday night has revealed worrying trends for Australia, showing that while students in this country perform better than the OECD average, results are slipping and are bedevilled by equity issues.
Ah, equity issues.
Here in New Zealand the media has been full of the news of us having plummeted in the rankings. This, of course, they blame on our current right wing government led by John ‘John the Jew’ Key. Unlike for the 2009 results they have neglected to publish the New Zealand numbers broken down by race (in 2009 Whites scored about the same as Finns, Asians scored lower, about the same as Japan, Maori scored about the same as Israel). For the 2012 results in mathematics they do say Asians stayed the same (they got 529 in 2009), whereas Whites declined (they got 537 in 2009). Immigrants apparently did as well as non-immigrants. They also say “New Zealand has a relatively large proportion of both top performers (Level 5 and 6) and low performers (below level 2) in mathematics.” and “New Zealand students demonstrated relative strength in the mathematical area of uncertainty and data (statistics) and weaker achievement in space and shape (geometry and measurement).” which doesn‘t sound very Asian so I guess Whites are still doing relatively well in Mathematics. 12/3/13, 5:58 PM
December 3, 2013
PISA reading scores by race: America does pretty well
On the international PISA tests in 2012, American 15-year-olds tended to do best on Reading Literacy, medium on Science Literacy, and worst on Mathematics Literacy. I have no idea whether that's for real or just a reflection of the difficulties of translating PISA tests into dozens of languages and making them equally hard in all. Here's our strong suit Reading, with American racial groups broken out according to the federal governments National Center for Education Statistics websitefor exploring the new PISA data:
| OECD average | 496 |
| Shanghai-China | 570 |
| Asian Americans | 550 |
| Hong Kong-China | 545 |
| Singapore | 542 |
| Japan | 538 |
| Korea, Republic of | 536 |
| Massachusetts All Races | 527 |
| Finland | 524 |
| Ireland | 523 |
| Chinese Taipei | 523 |
| Canada | 523 |
| Connecticut All Races | 521 |
| White Americans | 519 |
| Poland | 518 |
| Multiracial Americans | 517 |
| Estonia | 516 |
| Liechtenstein | 516 |
| New Zealand | 512 |
| Australia | 512 |
| Netherlands | 511 |
| Belgium | 509 |
| Switzerland | 509 |
| Macao-China | 509 |
| Vietnam | 508 |
| Germany | 508 |
| France | 505 |
| Norway | 504 |
| United Kingdom | 499 |
| United States | 498 |
| Denmark | 496 |
| Czech Republic | 493 |
| Florida All Races | 492 |
| Italy | 490 |
| Austria | 490 |
| Latvia | 489 |
| Hungary | 488 |
| Spain | 488 |
| Luxembourg | 488 |
| Portugal | 488 |
| Israel | 486 |
| Croatia | 485 |
| Sweden | 483 |
| Iceland | 483 |
| Slovenia | 481 |
| Hispanic Americans | 478 |
| Lithuania | 477 |
| Greece | 477 |
| Turkey | 475 |
| Russian Federation | 475 |
| Slovak Republic | 463 |
| Cyprus | 449 |
| Serbia, Republic of | 446 |
| African Americans | 443 |
| United Arab Emirates | 442 |
| Chile | 441 |
| Thailand | 441 |
| Costa Rica | 441 |
| Romania | 438 |
| Bulgaria | 436 |
| Mexico | 424 |
| Montenegro, Republic of | 422 |
| Uruguay | 411 |
| Brazil | 410 |
| Tunisia | 404 |
| Colombia | 403 |
| Jordan | 399 |
| Malaysia | 398 |
| Indonesia | 396 |
| Argentina | 396 |
| Albania | 394 |
| Kazakhstan | 393 |
| Qatar | 388 |
| Peru | 384 |
In reading, Asian Americans beat all Asian countries, and trailed only the prosperous city of Shanghai.
White Americans came in fourth among historically white countries, behind only Finland, Ireland, and Canada. White Americans beat a couple of dozen historically white countries wealthy enough to belong to the OECD. Of course, most of these aren't as white as they used to be anymore.
Hispanic Americans beat all eight Latin American countries.
African Americans didn't have any competition from predominantly black counties in Africa or the West Indies, but it's worth noting that African Americans beat all eight Latin American countries.
Keep in mind that this is just in Reading, which American tends to do better in than Math or Science.
Keep in mind that Americans spend a huge amount of money on education.
For more postings devoted to analyzing PISA scores, click the Labels: PISA below.
Keep in mind that Americans spend a huge amount of money on education.
For more postings devoted to analyzing PISA scores, click the Labels: PISA below.
A nation of C students - TIME
content.time.com/time/magazine/article/0,9171,2159268,00.html
18 hours ago - Despite a national push to improve student performance, American teens remain average in science and reading proficiency and below ...Students in Shanghai scored highest (China doesn't report on the whole country); Singapore, Japan and Hong Kong followed. U.S. students fell in the middle in all categories, with Peru, Indonesia and Qatar coming in last.
Read more: A nation of C students - TIME http://content.time.com/time/magazine/article/0,9171,2159268,00.html#ixzz2nkZ9ABN9
A Reason To Be Worried: U.S. Students Falling Behind - Investors.com
Dec 6, 2013 - The latest international student evaluations, the PISA test results, are ...science — are taken by Shanghai (China), Singapore, Hong Kong, ... IBD Forums: Participate in an IBD Forum and connect with other IBD subscribers.
A Reason To Be Worried: U.S. Students Falling Behind
17 Comments
Posted 12/06/2013
Read More At Investor's Business Daily: http://news.investors.com/ibd-editorials-on-the-left/120613-682111-american-students-dont-do-well-in-pisa-test.htm#ixzz2nkayqDQx
Follow us: @IBDinvestors on Twitter | InvestorsBusinessDaily on Facebook
t "none of the top-tier countries ... has a fixation on testing like the United States does."
It's hard to see how one could reach this conclusion. The top four slots in all three categories — math, reading, science — are taken by Shanghai (China), Singapore, Hong Kong, Taiwan, or Japan. They probably have the most test-centric systems in the world.
What's more worrying is that this particular test, PISA, is not focused on rote memorization but rather on the ability to use skills to solve real-world problems.
In fact, American schoolchildren do better in the other major international comparison, the TIMSS, which is a more traditional test of the academic curriculum. Does this mean we're teaching more by rote than do South Korea and Japan?
Read More At Investor's Business Daily: http://news.investors.com/ibd-editorials-on-the-left/120613-682111-american-students-dont-do-well-in-pisa-test.htm#ixzz2nkb6QTtl
Follow us: @IBDinvestors on Twitter | InvestorsBusinessDaily on Facebook
.Economist

32 comments: