
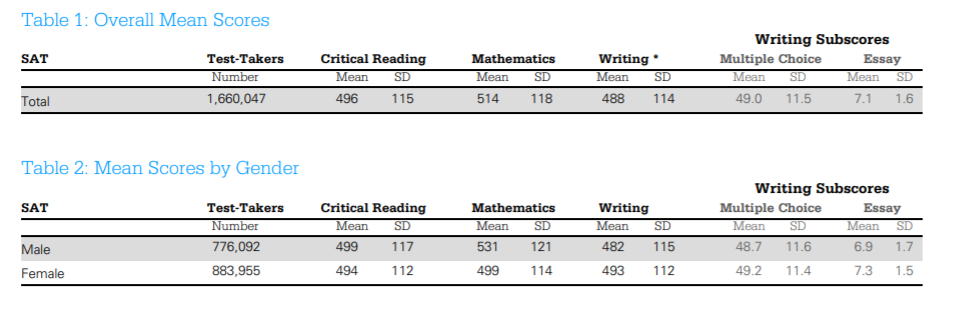
Affirmative Action includes gender preferences as well as better known race preferences. They are rarely acknowledged but stick out like a sore thumb at Cal Tech, MIT and Olin College of Engineering where women are admitted at rates 2 to 3 times the rates of men.
Here are some data points on admission/acceptance rates for colleges by gender:
Worcester Polytechnic Institute
admit rates men 44.7% women 59.2% slightly favors women
enrolled student population at Worcester Polytechnic Institute, both undergraduate and graduate, is 55.5% White, 7.23% Hispanic or Latino, 4.38% Asian, 2.54% Black or African American, 2.09% Two or More Races, 0.286% American Indian or Alaska Native, and 0.0301% Native Hawaiian or Other Pacific Islanders.
Cal Tech
Men 5.45
Women 15.5 2.84 or nearly 3 times men
Franklin W Olin College of Engineering
enrolls slighty more white women than men, but admit rate nearly 3X for women than men
Men 6.77%
Women 18.9%
Ratio 2.79
The enrolled student population at Franklin W Olin College of Engineering is
48.4% White, 12.7% Asian, 6.08% Two or More Races, 5.29% Hispanic or Latino,
1.32% Black or African American, 0.265% American Indian or Alaska Native,
and 0% Native Hawaiian or Other Pacific Islanders.
Students enrolled at Franklin W Olin College of Engineering in full-time
Undergraduate programs are majority White Female (26.9%),
followed by White Male (25.4%) and Asian Male (7.69%).

MIT
Men 5.76%
Women 12.8% ratio 2.22 twice rate of men
Harvard
Men 5.49
Women 5.31 about the same 0.967
UC Berkeley
15.1
18.7 1.23 about the same rate
Stanford
4.48 men 5.18 women 1.15
Luther College
https://datausa.io/profile/university/luther-college
https://datausa.io/profile/university/luther-college
Men 65% women 69% about equal
No comments:
Post a Comment